Key takeaways
- Conventional growth indices often confuse an expensive stock price with an expanding business. The two are not always synonymous.
- The RAFI Fundamental Growth Index selects and weights eligible U.S. large- and mid-cap stocks based on five business growth metrics: sales per share growth, gross profit growth, operating profit growth, R&D growth, and asset efficiency growth
- JPMorgan, Strategy, and NVIDIA illustrate how business growth and stock-price performance can diverge or coalesce and why that distinction matters for growth index methodology.
- This RAFI approach has outperformed the Russell 1000 Growth Index over the study period and offers a different perspective on how growth indices should be constructed.
Today, growth investing is almost synonymous with large technology companies. These firms have delivered extraordinary returns as their artificial intelligence (AI) breakthroughs and ambitious visions of the future have dominated the headlines. But a rising stock price and a growing business are not the same thing. Though some mega-cap tech companies are rapidly expanding, others are simply expensive.
Traditional growth indices often blur that distinction. They classify stocks using a mix of valuation ratios and growth measures and then weight them by market capitalization. As a result, a company’s index weight may increase simply due to investor optimism, even when the underlying business has not kept pace, a concept Arnott et al. (2026) explore in detail.
The RAFI Fundamental Growth Index takes a different approach. Rather than favoring companies the market regards as growth stocks, it looks for those with fast-growing businesses. The index selects the top 25% of eligible large- and mid-cap U.S. stocks as determined by five measures of realized business growth: sales per share growth, gross profit growth, operating profit growth, R&D growth, and asset efficiency growth. Results are then averaged over the prior three, four, and five years and each company weighted by those same metrics.¹ A constituent’s weight reflects the pace of business expansion rather than how richly the market values the company.²
So, which companies qualify for inclusion? Several examples demonstrate how this fundamentals-based definition of growth produces a very different portfolio than traditional growth indices.³
JPMorgan Chase
Banks are rarely top of mind when investors think “growth stocks.” These firms lack the glamour of the Magnificent Seven and the associated AI boom. Conventional growth indices reflect that bias. With their emphasis on valuation and market-capitalization weighting, they prioritize pricey technology stocks and often overlook cheaper, fast-growing businesses from other sectors. Indeed, as of September 30, 2026, tech firms accounted for 56% of the Russell 1000 Growth Index’s weight, while financials took up a mere 5%. The RAFI Fundamental Growth Index, by contrast, was 26% tech and 23% financials.
Exhibit 1. Sector Weights
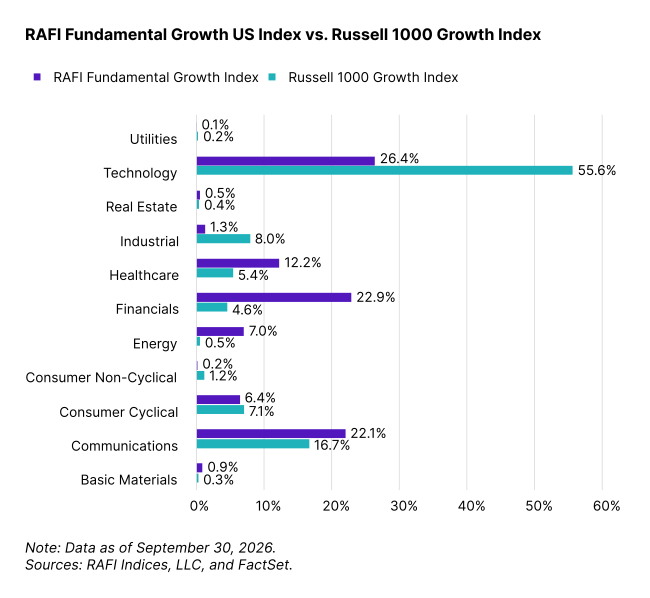
Like most large banks, JPMorgan trades at a modest valuation: a 2.5 price-to-book ratio versus 9.3 for the median Russell 1000 Growth constituent, as of September 30, 2026. The firm remains a mainstay of value indices rather than growth indices, even as its underlying business has grown substantially. Over the five years through 2025, JPMorgan’s operating and pre-tax income expanded at annualized rates of 14.6% and 15.2%, respectively, while net-interest and non-interest income grew 11.8% and 6.9%. Favorable conditions explain some of that profit growth: The U.S. Federal Reserve’s 2022 and 2023 rate hikes widened lending margins, and JPMorgan’s 2023 acquisition of First Republic artificially boosted earnings. Still, compounding profits at double-digit rates for five years is rare for any company in any sector, let alone one of JPMorgan’s size.
The RAFI Fundamental Growth Index does not ask whether a company looks or trades like a growth stock. It asks whether the business is growing. Across the entire U.S. large- and mid-cap universe, JPMorgan ranks 30th on RAFI Growth scores, higher than Tesla, which comes in 68th, as well as many other “growth” companies. JPMorgan’s inclusion is not a quirk but a direct expression of the RAFI methodology.
Strategy
Strategy, formerly MicroStrategy, joined the Russell 1000 Growth Index in June 2024 following a swift rise in its market capitalization. Upon inclusion, the company had a price-to-sales ratio of 51. The rally didn’t stop there. Strategy’s market cap rose 193% the following year before falling 78% over the next 12 months. For much of that stretch, the company, whose value depended almost entirely on bitcoin prices, maintained its place in the growth benchmark even as its underlying business deteriorated.
Exhibit 2 shows how far price and fundamentals diverged. Strategy’s sales, gross profit, and operating profit per share all peaked in mid-to-late 2020 and then declined steadily. By June 2024, when the company joined the index, each metric had fallen by roughly half. Yet, from September 2020 to June 2024, the stock rose 815%.
Exhibit 2. Strategy growth metrics per share
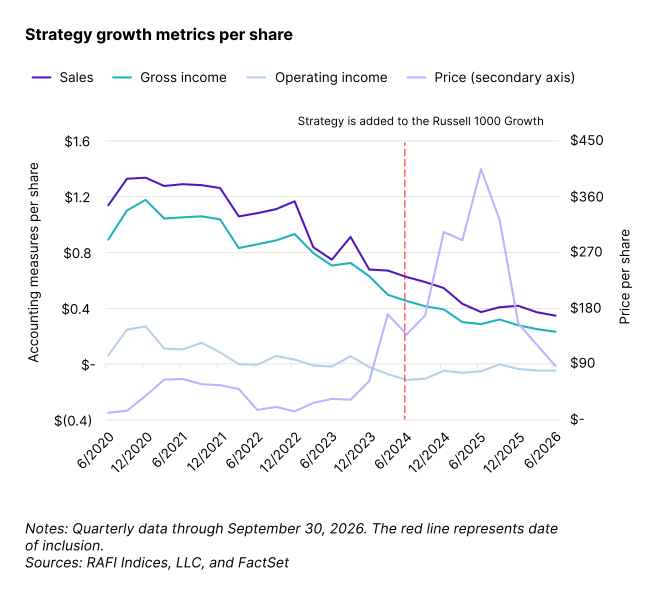
Dilution accounted for much of that per-share decline. To fund bitcoin purchases, Strategy issued new shares and convertible debt, raising its share count 156% from year-end 2020 to year-end 2024. The core software business did little to offset it: revenue, gross profit, operating profit, and R&D spending were flat to declining over the period. Meanwhile, as bitcoin piled up on the balance sheet, asset efficiency fell sharply, with each dollar of assets generating less in sales. These are the measures the RAFI Fundamental Growth Index uses to select companies, and on them Strategy showed little to no growth. A traditional growth index saw a soaring market value; a fundamentals-based one saw a shrinking business behind each share.
Shareholders who bought before or soon after inclusion were handsomely rewarded. But a rising stock price backed by weak fundamentals is a risky bet: The outcome depends on market sentiment holding rather than real or sustained business success. Strategy demonstrates that stagnation is not always a barrier to inclusion in traditional growth indices. The RAFI Fundamental Growth Index, on the other hand, did not include Strategy at any point during this period.
NVIDIA
If traditional growth indices sometimes reward price without growth, does a fundamentals-based growth strategy simply avoid expensive stocks altogether? NVIDIA shows that it doesn’t. The company’s stock has soared on its central role in the AI boom. But unlike Strategy, its business has kept pace.
Over the five years ending January 2026, NVIDIA’s sales per share grew more than 13-fold, an annualized rate of 67.7%. Its share price has kept pace, rising nearly 15-fold (71.2% annualized) over the same period. The other RAFI growth metrics tell the same story: operating profit grew 28-fold, gross profit almost 15-fold and R&D spending nearly 5-fold, while asset efficiency nearly doubled.
Exhibit 3. NVIDIA 5-year growth metrics

NVIDIA is the rare instance where investor enthusiasm and business results have moved together. The market expected extraordinary growth, and the company delivered. With a 9.7% weight, NVIDIA is the second-largest holding in RAFI Fundamental Growth as of September 30, 2026. That weight does not reflect market capitalization but rather strong underlying growth.
NVIDIA also clarifies what the RAFI philosophy is not. By owning companies with strong underlying growth, whether they are trading at high or low valuations, RAFI is neither a bet against technology nor a value strategy in disguise.
Performance
Does a fundamentals-based approach to growth investing lead to better investment outcomes? Historically, it has. From June 1997 through September 30, 2026, with results simulated prior to its July 17, 2025 launch, RAFI Fundamental Growth generated 15.1% annualized returns versus 10.1% for the Russell 1000 Growth Index. Compounded over the full sample, that gap adds up to roughly 270% more ending wealth for RAFI than the benchmark.
During the dot-com era, the RAFI Growth strategy also outperformed, and not by avoiding tech stocks. In June 2000, the tech sector accounted for about 63% of the index’s weight, 10 percentage points more than the Russell 1000 Growth. The difference was which technology companies RAFI held. It favored those with real sales and profit growth rather than sky-high valuations. When the market soured on overhyped tech companies, those firms with expanding fundamentals survived.
The index lagged in 2019 largely because of its treatment of mega-cap tech stocks. RAFI Growth held no Microsoft, one of the year’s best performers, and less Apple than the benchmark. Those shortfalls more than offset larger positions in Amazon, Alphabet, and Facebook. In a year when big names dominated benchmark returns, weighting by growth rather than market cap constituted a headwind.
Exhibit 4: RAFI Growth Index vs. Russell 1000 Growth
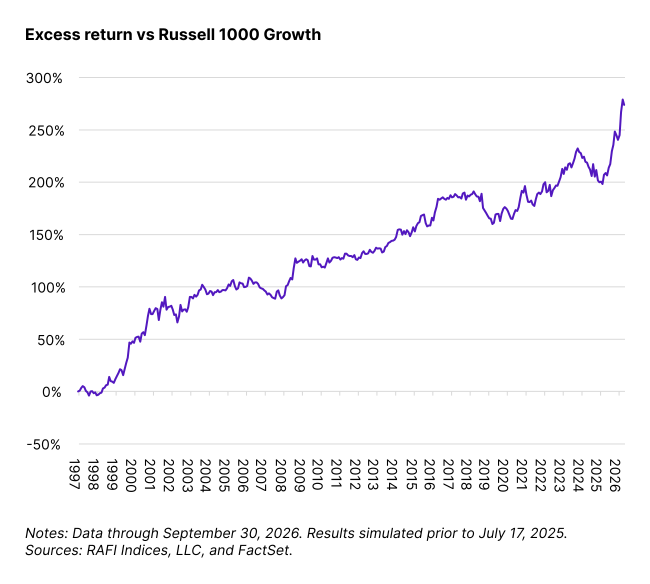
The early results are encouraging. Since its launch, the index has returned an annualized 36.1% versus the Russell 1000 Growth’s 14.8%. Fourteen months is too short a sample to draw any firm conclusions, but so far the live record is consistent with the simulated one.
Conclusion
So, what belongs in a growth index? Companies whose businesses are growing, regardless of share price or valuation.
Our three examples emphasize why this definition matters. JPMorgan has expanded like a growth company, but its low valuation keeps it out of many traditional growth indices. As its stock soared, however, Strategy joined the Russell 1000 Growth Index even as its business metrics were deteriorating. NVIDIA demonstrates that the two definitions can agree: Both approaches recognize when a company’s price and business grow in tandem. What separates them is what happens when prices and growth diverge.
Returns alone do not prove an index methodology’s soundness. Still, the record fits the intuition behind the index. Companies with expanding businesses provide a stronger foundation for growth investing than those that earned their spots because of rising share prices. By anchoring index construction to realized business growth rather than market expectations, the RAFI Fundamental Growth Index offers new insight into what growth investing should own.
End notes
Arnott, Robert D., Chris Brightman, Campbell R. Harvey, Que Nguyen, and Omid Shakernia. 2026. “Fundamental Growth.” Financial Analysts Journal 82(2): 46–68.
1 We define asset efficiency growth as the growth in the total sales to total assets ratio.
2 RAFI Indices, LLC. 2026. “RAFI Fundamental Growth Index Series: Methodology & Standard Treatment. Version 1.2.”
3 Company growth figures are illustrative and unless otherwise noted are calculated from reported financial statements over the most recent five fiscal years using FactSet data. They approximate but are not identical to the inputs used in index construction, which rely on Worldscope data definitions and apply a one-year lag.


