Multi-factor index strategies entered the mainstream more than a decade ago, driven by a compelling proposition. By systematically combining exposures to value, quality, momentum, low volatility, and size, investors could potentially improve risk-adjusted returns while reducing reliance on any single investment style. The objective was not to eliminate periods of underperformance, but to provide a smoother path than standalone factor strategies and a diversified alternative to traditional capitalization-weighted indices.
The market environment that followed proved unusually challenging. Over the last decade, equity market leadership became increasingly concentrated in a narrow group of mega-cap growth stocks. Capitalization-weighted indices benefited as the strongest-performing companies became ever-larger benchmark constituents, while many traditional long-only factor strategies faced persistent headwinds. Consequently, the median multi-factor ETF underperformed the S&P 500 by 4.8% annualized over the period, and investor enthusiasm faded, culminating in approximately $763 million of net outflows in 2023.
More recently, that trend has begun to reverse. Concerns about market concentration, elevated valuations among the largest benchmark constituents, and narrow market breadth have renewed interest in diversified sources of equity return. Multi-factor ETFs in the United States averaged approximately $3.8 billion in flows in 2024 and 2025. Through June 2026, flows reached nearly $5 billion, putting the category on pace for one of its strongest years in recent history.1
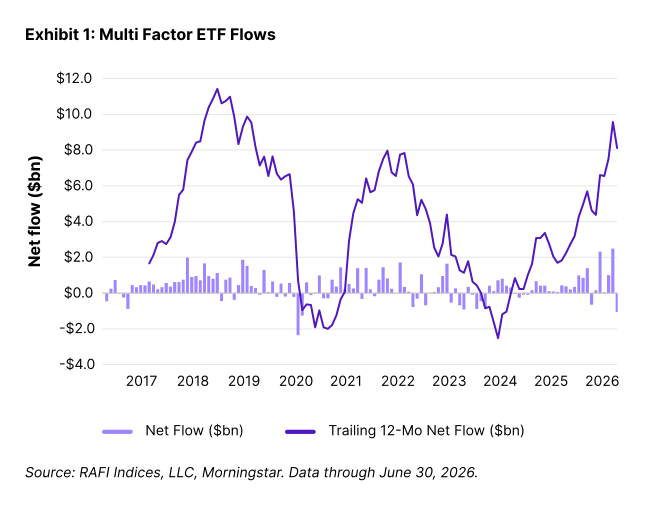
If diversified factor investing struggled during one of the strongest equity markets in history, why reconsider it now? We believe the answer lies in understanding why it struggled. Multi-factor strategies continued to provide diversification, but that diversification became less valuable relative to a market increasingly driven by a small number of companies. In this article, we examine the construction of the RAFI Multi-Factor Index, how it performed in that environment, and why current market concentration may make diversified factor exposure more relevant today.
What is RAFI Multi-Factor?
The RAFI Multi-Factor Index strategy is a rules-based, transparent smart beta index that offers diversified factor exposures through a combination of five theoretically sound and empirically robust single-factor strategies: value, low volatility, quality, momentum, and size. Each factor is constructed by selecting the top 25% of the security universe by factor definition and weighting each company by its respective fundamental weight2 to create targeted, concentrated factor exposures3.
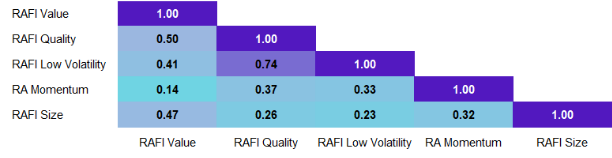
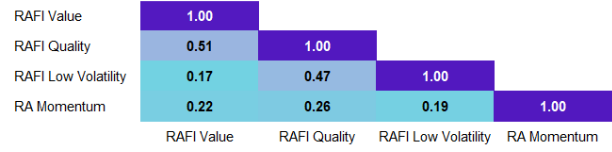
Through these concentrated exposures, the RAFI Multi-Factor index is expected to offer higher returns. Over time, it should provide a smoother ride than strategies that rely on a single factor because the five factors have moderate to low correlations of excess returns, as shown in Exhibit 2. Momentum, for example, has historically had low correlation with value. Size has also behaved differently from quality and low volatility. No single factor has consistently dominated the strategy. The design of RAFI Multi-Factor reflects a simple premise: diversify equity exposure across return drivers rather than concentrating capital based on price alone.
Exhibit 2: Correlation of Excess Returns for RAFI Single Factor Strategies
Developed
United States
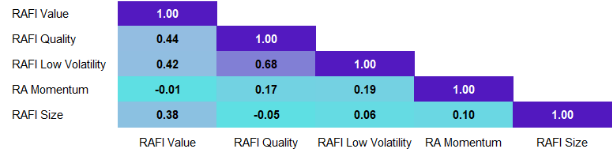
Emerging Markets
Source: RAFI Indices LLC, FactSet. Data through June 30, 2026.
Note: RAFI Multi-Factor index performance before each index’s launch date is simulated.
Performance in context
The growth dominance of the last decade put diversified factor exposure to a difficult test. Nevertheless, RAFI Multi-Factor has outperformed its broad market benchmarks over its longest available historical periods. The Developed, U.S., and Emerging Markets indices outperformed their respective benchmarks by 1.8%, 1.6%, and 3.2%, annualized, respectively. It has also compared favorably with the broader multi-factor universe, outperforming the corresponding median multi-factor ETF over the 3-, 5-, and 10-year periods shown in Exhibit 3. Over the trailing 10 years, the respective RAFI Multi-Factor indices returned 12.3%, 13.9%, and 10.3% annualized, compared with 12.0%, 12.9%, and 9.1% for their median multi-factor peers. The comparison matters because “multi-factor” describes a broad category rather than a uniform investment approach. Factor definitions, portfolio concentration, weighting, and rebalancing can differ materially across strategies.
Exhibit 3: RAFI Multi-Factor Performance
| Index | 1-Year | 3-Year | 5-Year | 10-Year | Total Return | Standard Deviation | Sharpe Ratio | Tracking Error |
| RAFI Multi-Factor Developed Index | 26.3% | 20.7% | 12.6% | 12.3% | 11.1% | 13.6% | 0.6 | 3.8% |
| Median Multi-Factor ETF - Developed | 20.6% | 17.5% | 10.8% | 12.0% | ||||
| MSCI - World Index | 21.8% | 19.8% | 12.0% | 13.7% | 9.3% | 14.8% | 0.5 |
| Index | 1-Year | 3-Year | 5-Year | 10-Year | Total Return | Standard Deviation | Sharpe Ratio | Tracking Error |
| RAFI Multi-Factor US Index | 28.5% | 21.4% | 13.5% | 13.9% | 12.6% | 13.8% | 0.7 | 4.4% |
| Median Multi-Factor ETF - US | 26.4% | 17.0% | 9.7% | 12.9% | ||||
| Russell 1000 Index | 22.0% | 20.5% | 12.7% | 15.3% | 11.0% | 15.3% | 0.5 |
| Index | 1-Year | 3-Year | 5-Year | 10-Year | Total Return | Standard Deviation | Sharpe Ratio | Tracking Error |
| RAFI Multi-Factor Emerging Markets Index | 30.7% | 18.0% | 9.7% | 10.3% | 12.0% | 20.6% | 0.5 | 4.8% |
| Median Multi-Factor ETF - Emerging Markets | 34.6% | 20.2% | 7.4% | 9.1% | ||||
| MSCI Emerging Markets Index | 37.1% | 19.9% | 8.5% | 9.6% | 9.7% | 20.5% | 0.4 |
Source: RAFI Indices LLC, FactSet, and Morningstar. Data April 1, 1992 through June 30, 2026. Note: RAFI Multi-Factor index performance before each index’s launch date is simulated. Median multi-factor ETF returns are based on available fund histories and therefore are not shown for the full historical period.
If diversification across multiple return drivers improves portfolio outcomes, why did diversified factor portfolios struggle against capitalization-weighted benchmarks during one of the strongest equity markets in history? The answer is not that RAFI Multi-Factor stopped providing the exposures it was designed to provide—quite the opposite. The strategy remained diversified while the market became increasingly concentrated.
Long-only factor strategies tend to have a countercyclical element built into their construction. Periodic rebalancing requires them to maintain their intended factor exposures, which frequently means trimming companies that have appreciated and reallocating toward companies with more attractive factor characteristics. In a prolonged bull market led by a narrowing group of growth stocks, that discipline becomes a headwind.
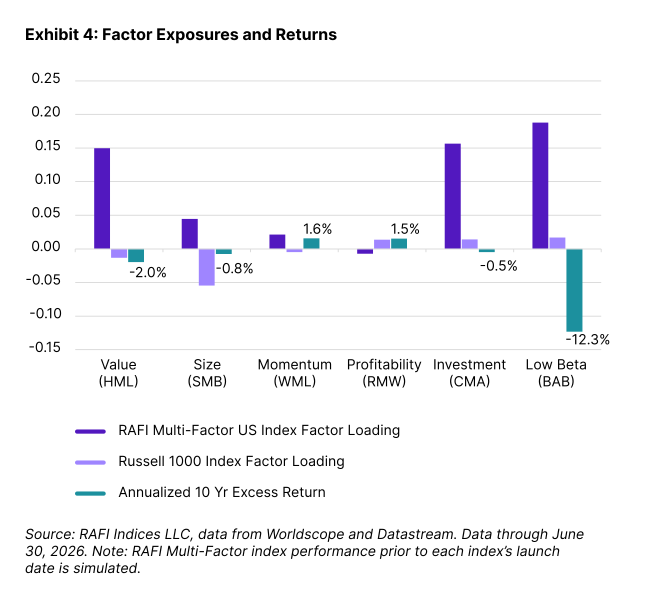
Exhibit 4 puts this in context. Over the last 10 years, the RAFI Multi-Factor U.S. Index maintained materially stronger factor loadings than the Russell 1000, but most of those factors delivered weak or negative excess returns. The challenge was therefore not an absence of factor exposure, but an environment in which diversified factor exposure was broadly unrewarded.
Those factor loadings are the aggregate result of company-level decisions. The largest holdings in RAFI Multi-Factor and the capitalization-weighted benchmark illustrate how different portfolio construction approaches can produce meaningfully different company weights. Intel is the largest holding in RAFI Multi-Factor at 3.0%, roughly three times its capitalization weight. It qualified for the value sleeve when it ranked among the cheapest large semiconductor companies by fundamental measures, and its recovery since then earned it a place in momentum as well.
NVIDIA presents a different case. Its operating and share-price performance has been exceptional, helping it grow to 6.7% of the capitalization-weighted benchmark. Within RAFI Multi-Factor, however, NVIDIA currently receives support only from momentum, resulting in a much smaller 0.9% weight.
Exhibit 5: Comparing Security Weights and Factor Contributions
Top 5 Multi-Factor Holdings
| Multi-Factor Weight | Cap Weight | Active Weight | Value | Low Volatility | Quality | Momentum | Size | |
| Intel | 3.0% | 0.9% | 2.1% | 2.5% | - | - | 0.6% | - |
| Walmart | 1.8% | 0.7% | 1.1% | 0.4% | 0.9% | - | 0.5% | - |
| Eli Lilly | 1.8% | 1.4% | 0.4% | - | 0.3% | 0.5% | 1.0% | - |
| Broadcom | 1.7% | 2.5% | -0.8% | - | - | 0.8% | 0.9% | - |
| Johnson & Johnson | 1.6% | 0.9% | 0.7% | - | 0.8% | 0.5% | 0.3% | - |
| Total | 10.0% | 6.4% | 3.6% |
Top 5 Cap Weight Holdings
| Multi-Factor Weight | Cap Weight | Active Weight | Value | Low Volatility | Quality | Momentum | Size | |
| NVIDIA | 0.9% | 6.7% | -5.8% | - | - | - | 0.9% | - |
| Apple | 1.0% | 6.0% | -5.0% | - | - | 1.0% | - | - |
| Alphabet | 0.9% | 5.4% | -4.5% | - | - | - | 0.9% | - |
| Microsoft | - | 4.0% | -4.0% | - | - | - | - | - |
| Amazon | - | 3.3% | -3.3% | - | - | - | - | - |
| Total | 2.9% | 25.5% | -22.6% |
The broader set of holdings in Exhibit 5 shows how these company-level differences affect portfolio concentration. RAFI Multi-Factor's five largest holdings account for 10.0% of the index, each supported by multiple factor sleeves. By comparison, the five largest capitalization-weighted holdings account for 25.5% of the benchmark, yet qualify for at most one sleeve within RAFI Multi-Factor, and two qualify for none at all, leaving them a combined 2.9% of the index.
This is not a judgment about NVIDIA or the other largest benchmark constituents. The distinction is one of portfolio construction. A capitalization-weighted strategy allows share-price appreciation to increase portfolio weight automatically, while RAFI Multi-Factor requires a company to qualify through the underlying factor definitions. Applied across the investable universe, that process diversifies not only across companies and sectors, but across the characteristics expected to drive returns.
When concentration is winning, diversification gets tested
The final stages of the dot-com boom offer a useful historical example of the challenge diversified strategies face in a highly concentrated market. During the buildup, 52.4% of the S&P 500’s return was attributable to just 10 companies, nine of which outperformed the index. As those companies continued to rally, their capitalization weights increased, and the benchmark became increasingly dependent on their performance.
That relationship changed sharply when the technology bubble unwound. From March 2000 through September 2002, 7 of the 10 largest companies underperformed the S&P 500, and many of the same stocks that had driven market gains contributed disproportionately to the subsequent drawdown.
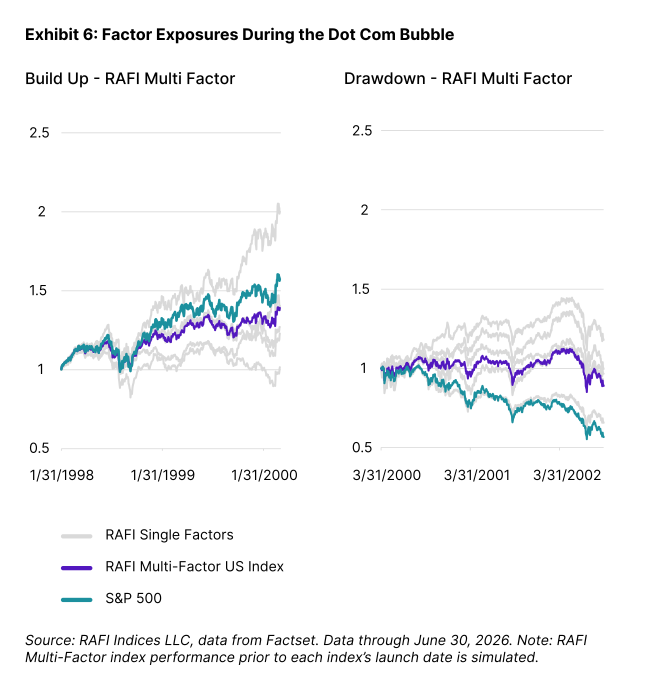
RAFI Multi-Factor behaved differently across the two phases. During the buildup, several factor sleeves struggled to keep pace with the technology-led market, while momentum benefited from the prevailing trend. The overall strategy trailed the capitalization-weighted benchmark by 18%, although it performed substantially better than several individual factors.
The subsequent drawdown produced a different outcome. Momentum became a headwind, but the other factor exposures provided diversification, and RAFI Multi-Factor outperformed by 33%.
This dynamic is not isolated to the U.S. or the dot-com era alone. A similar pattern unfolded during the 2020–2021 China tech boom, where a concentrated handful of mega-cap internet and e-commerce companies swelled to outsized weights and drove massive initial index gains. When regulatory crackdowns and shifting market sentiment sparked a sharp reversal in 2021, those top-heavy positions rapidly unwound and dragged down the broader market. As in the early 2000s, this environment tested capitalization-weighted benchmarks, and the RAFI Multi-Factor Emerging Markets Index stayed in line during the buildup and outperformed its benchmark by 15% during the subsequent drawdown.
These episodes illustrate the role of factor diversification. Momentum led during the buildup and struggled in the reversal, while other factors followed different paths. A multi-factor approach does not require identifying the next factor leader; it accepts that leadership will change and diversifies across those shifts.
Where are markets today?
Today’s market again exhibits unusually high concentration. As of June 2026, the 10 largest companies accounted for 34.9% of the Russell 1000, 26.8% of developed markets, and 41.0% of emerging markets. Effective N4 tells a similar story. Over approximately the last decade, the effective number of holdings in traditional capitalization-weighted benchmarks declined by roughly 65% to 75%, while the effective diversification of RAFI Multi-Factor remained substantially more stable. Exhibit 7 shows RAFI Multi-Factor’s Effective N relative to that of the corresponding capitalization-weighted benchmark.
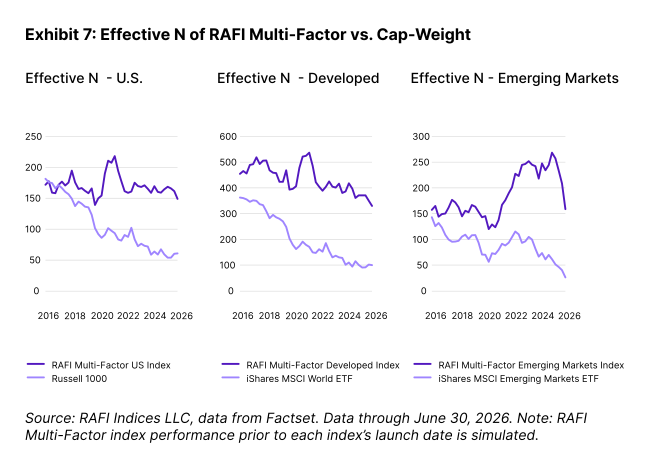
A benchmark can therefore contain hundreds or thousands of securities while remaining economically dependent on a relatively small number of companies. As those companies appreciate, capitalization weighting automatically allocates more capital to them, increasing their contribution to both benchmark return and risk. This paradigm was prominent during the dot-com buildup, when market concentration reached extreme levels, and the Effective N of the RAFI Multi-Factor U.S. Index rose to nearly twice that of its capitalization-weighted benchmark.
We do not know when current market leadership will change, nor does the dot-com comparison imply that today’s largest companies face the same outcome. The relevant issue is portfolio dependence. Investors in a capitalization-weighted index increasingly rely on a relatively small number of companies to justify very large benchmark weights.
Conclusion
For investors seeking to diversify away from concentrated capitalization-weighted benchmarks, RAFI Multi-Factor offers a different portfolio construction framework. Rather than allowing market price alone to determine allocations, it distributes exposure across value, quality, low volatility, momentum, and size.
The distinction also matters within the multi-factor category. Multi-factor strategies can vary substantially in the strength and persistence of their factor exposures. RAFI Multi-Factor is designed to provide targeted exposure to each underlying factor and then diversify across them, reducing reliance on any one factor or market regime.
The strategy will not outperform in every environment, as the last decade demonstrates. But with capitalization-weighted benchmarks increasingly dependent on a small group of companies and factor leadership difficult to forecast, we believe RAFI Multi-Factor offers a compelling alternative for investors seeking more deliberate diversification across multiple potential sources of excess return.
(1) Source: Morningstar. Flow data reflect estimated net flows for U.S. open-end funds and ETFs classified by Morningstar as “Strategic Beta: Multi-Factor,” limited to passively managed strategies and including obsolete funds. Data through June 30, 2026.
(2) Momentum, which uses the top 50% of the security universe and is capitalization-weighted, is the exception.
(3) We construct our size factor using a multi-factor approach within the small-company universe. We have long questioned the efficacy of small-cap stocks as a standalone equity factor. Whereas small-cap stocks outperform large-cap stocks, their risk is higher and they do no offer meaningfully higher returns on a risk-adjusted bases. Questions remain about the robustness of size investing alone, but research has shown (e.g. Hsu et al. [2016]) that other factors work particularly well within the small-cap universe.
(4) Effective N is the inverse of the Herfindahl-Hirschman Index (HHI). A higher effective N represents a higher level of diversification.